Burning Man Sept 1 2012 |
|
In 2006 I looked at the GCP data over an 8 year period, during the most intense day, the Saturday of the burning. The result was sufficiently strong that I decided to make a formal prediction for 2007. Here is part of a description from the exploratory analysis.
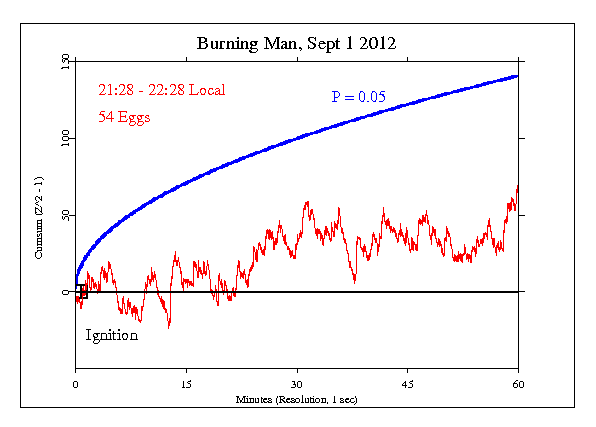
The main event is on the Saturday before Labor Day, September 1st this year, and the location is in the Nevada desert. The time of the burning varies depending on conditions. This year, the burn was expected to begin at about 9:30 PM Pacific time, and the actual Ignition was exactly at 9:28. As in earlier analyses, we specify an hour long event beginning at Ignition. This corresponds to 0428 to 0528 GMT on September 2nd. (Note, my original information incorrectly set the period an hour later, but the onsite team provided accurate timing for the burn.) The result shows a Chisquare of 3666.195 on 3600 df, for p = 0.217 and Z = 0.783 For the formal test, the terminal Z indicates a positive result, and observers may take note of the modest but steady trend. As always, we recommend cautious interpretation because the signal to noise ratio in GCP data is very small.

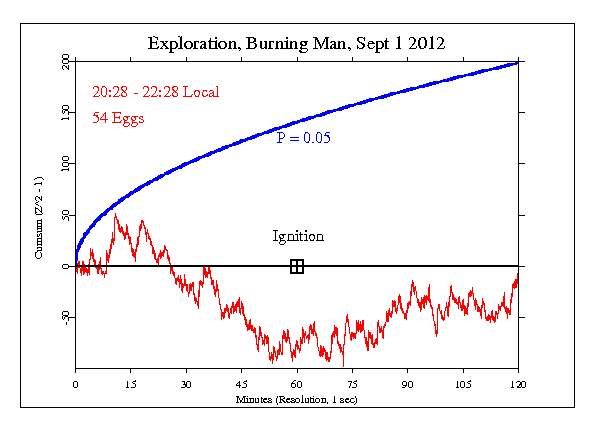
ExplorationsSince the IONS team used two hours surrounding the Ignition moment, we take a look here at the GCP data for that period in two different formats. The first is the usual cumulative deviation as used in the formal analysis.

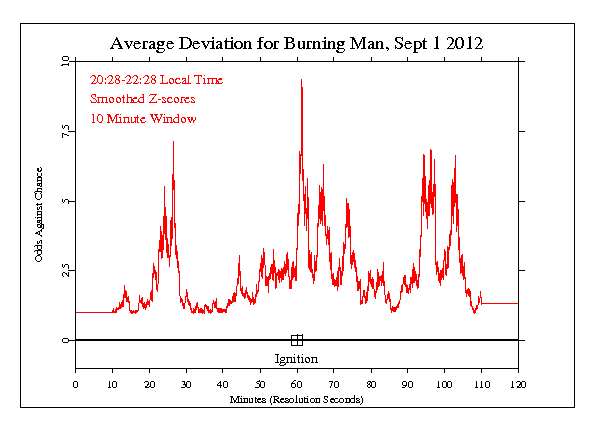
The second is a plot of the odds ratio for the average deviation of the same data sequence. This is a smoothed curve (knn algorithm, which centers the running mean on the middle of the window) with a window length of 10 minutes. The spike in the middle, which has odds of about 10 to one against chance, starts almost exactly at Ignition and peaks about a minute later. Whether it reflects a little spike in global consciousness is questionable, but the timing is pretty.

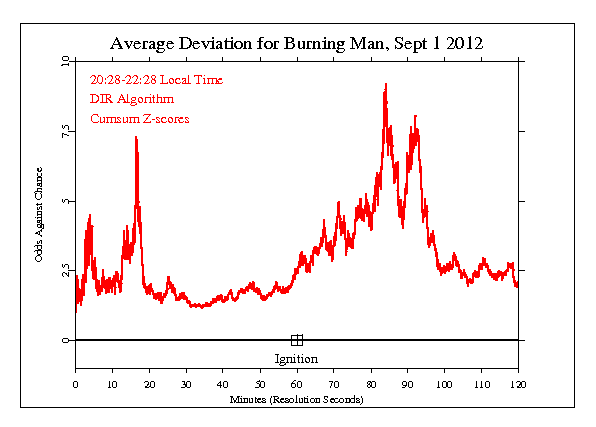
Looking at the GCP data with a different algorithm, applied by Dean Radin to the local RNG data, we get yet another perspective. This procedure calculates the probabilities as the Z scores accumulate. The corresponding odds ratios are relatively small (less than 10 to 1) but the concentration is mainly after the Ignition event. This is consonant with expectations.

It is important to keep in mind that we have only a tiny statistical effect, so that it is always hard to distinguish signal from noise. This means that every "success" might be largely driven by chance, and every "null" might include a real
|