|
On August 15 at 18:40 local time in Peru, a Richter
magnitude 8 earthquake caused great damage and
hundreds of deaths (late on the 16th estimates suggested
more than 500 dead and 1500 injured). The quake was centered near the coast of
Peru about 150 Km SSE of Lima. The hardest hit city was
Pisco, with 200 people killed and 70% of the city destroyed.
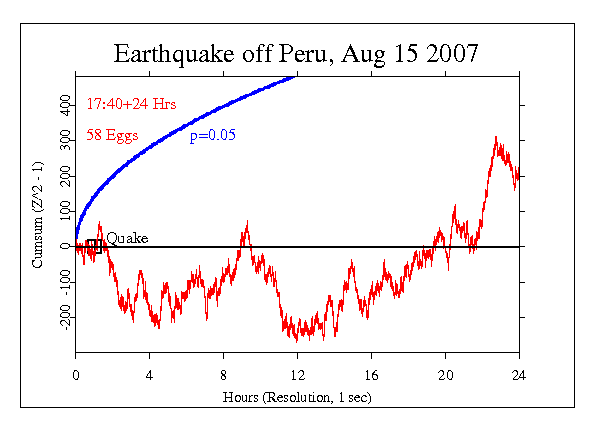
The time for the formal hypothesis test was set for a 24
hour period beginning about an hour before the quake. This
relatively long event time was suggested by noting that
effects associated with the Indian Ocean Tsunami did not
begin until some 20 hours after the temblor.
The result is Chisquare 86613 on 86400 df, for p = 0.304
and Z = 0.514. This is a positive but modest deviation. The
graph shows a sharp negative trend immediately after the
quake, but some 10 or 11 hours later it takes on a fairly
steady positive trend that continues for the rest of the 24
hours.

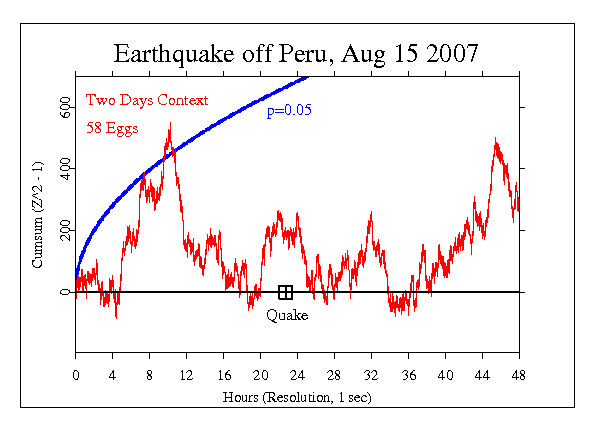
In the next figure, we see a bit more of the context, with 2
days surrounding the quake. Reminiscent of the Tsunami case,
there is a huge spike roughly 12 hours before the primary
temblor.

Continuing the exploration, we also looked at the variance
over the two days surrounding the quake. The figure shows
the cumulative deviation of the device variance relative to
the mean of the variance. There is an impressive, steep
reduction of variance reaching a minimum 11 to 15 hours before the
main temblor, increasing to a normal level by the time of
the quake, then continuing at the expected level. For
comparison, the cumulative deviation of variance
on September 11 2001 is shown.

|