Control Data and Control Distributions
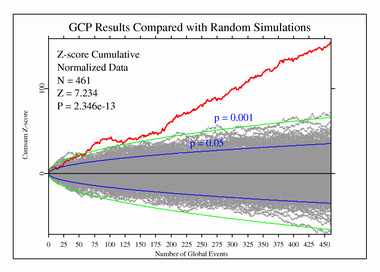
It is important to compare the experimental data with an appropriate control population. There are a number of possible ways to do this. We automatically generate pseudorandom data two days after the real data have been recorded, and in principle, we could compare the analysis of each event against its pseudorandom counterpart. A more comprehensive procedure is to generate a large population of controls, and that can be done by resampling from the actual data that are not used in the formal series, or by simulations using a high quality random number generator. The figure below displays a population of 500 simulated formal series, and shows the real data against this background.

For single events, we acknowledge that the tiny statistical effect makes it hard to distinguish signal from noise. However, a real effect can be identified by patiently accumulating replications of similar analyses, as is clearly displayed in this figure.
