Pagetitle
(CNN)A powerful storm toppled a construction crane Friday afternoon at the Masjid al-Haram, or Grand Mosque, in Mecca -- killing at least 107 people and injuring 238 others, Saudi Arabia's civil defense authorities said on Twitter.
Photos and video on social media showed the crane crashing through the mosque roof and the aftermath, with bodies, blood and debris spread across the courtyard.
The crane fell 10 days before the start of the Hajj, the annual pilgrimage expected to bring 2 million people to Mecca. The Masjid al-Haram is the largest mosque in the world and surrounds Islam's holiest site, the Kaaba -- a cube-shaped shrine that worshippers circle.
One man said the bad weather contributed to the chaos after the crane toppled over.
"We just washed and were getting ready to head to the Masjid al-Haram for the Maghrib prayer (sunset prayer)," said Yahya Al Hashemi, 30, a CNN iReporter who shot iPhone video of the crane striking the roof of the mosque. "It was a sandstorm which turned to rainstorm and lot of the construction covering boards were flying around, and lots of cracking noises which unfortunately ended with this tragedy. ... Everybody were pushing trying to escape from inside towards the exits."
More than 50 rescue teams and 80 ambulances converged on the mosque as part of the rescue effort after the crane fell at 5:24 p.m. local time (10:23 a.m. ET), said Saudi Civil Defense Director Maj. Gen Suleiman al-Amro.
A strong thunderstorm developed over Mecca at about 4 p.m. local time Friday (9 a.m. ET), bringing gusty winds that shifted direction and caused the local temperature to drop from 42 to 25 degrees Celsius (107.6 to 77 degrees Fahrenheit), CNN meteorologists reported.
Specific Hypothesis and Results
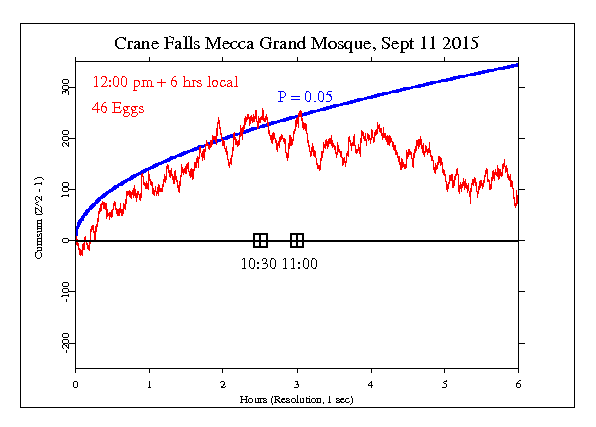
The GCP hypothesis was suggested by Hans Wendt and combines the anniversary of the 9/11 terror attacks and the tragic accident in Mecca. The formal event is 6 hours beginning at 4pm local time (13:00 UTC), when the powerful windstorm began. This corresponds to 09:00 ET, roughly the time of the attacks on the WTC towers. The result is Chisquare 21680 on 21600 df, for p = 0.348 and Z = 0.389.
Interpretation
The following graph is a visual display of the statistical result. It shows the second-by-second accumulation of small deviations of the data from what’s expected. Our prediction is that deviations will tend to be positive, and if this is so, the jagged line will tend to go upward. If the endpoint is positive, this is evidence for the general hypothesis and adds to the bottom line. If the endpoint is outside the smooth curve showing 0.05 probability, the deviation is nominally significant. If the trend of the cumulative deviation is downward, this is evidence against the hypothesis, and is subtracted from the bottom line. For more detail on how to interpret the results, see The Science and related pages, as well as the standard caveat below.

Standard caveat
It is important to keep in mind that we have only a tiny statistical effect, so that it is always hard to distinguish signal from noise. This means that every success
might be largely driven by chance, and every null
might include a real signal overwhelmed by noise. In the long run, a real effect can be identified only by patiently accumulating replications of similar analyses.
